What the Seattle metro economy is worth, 2023
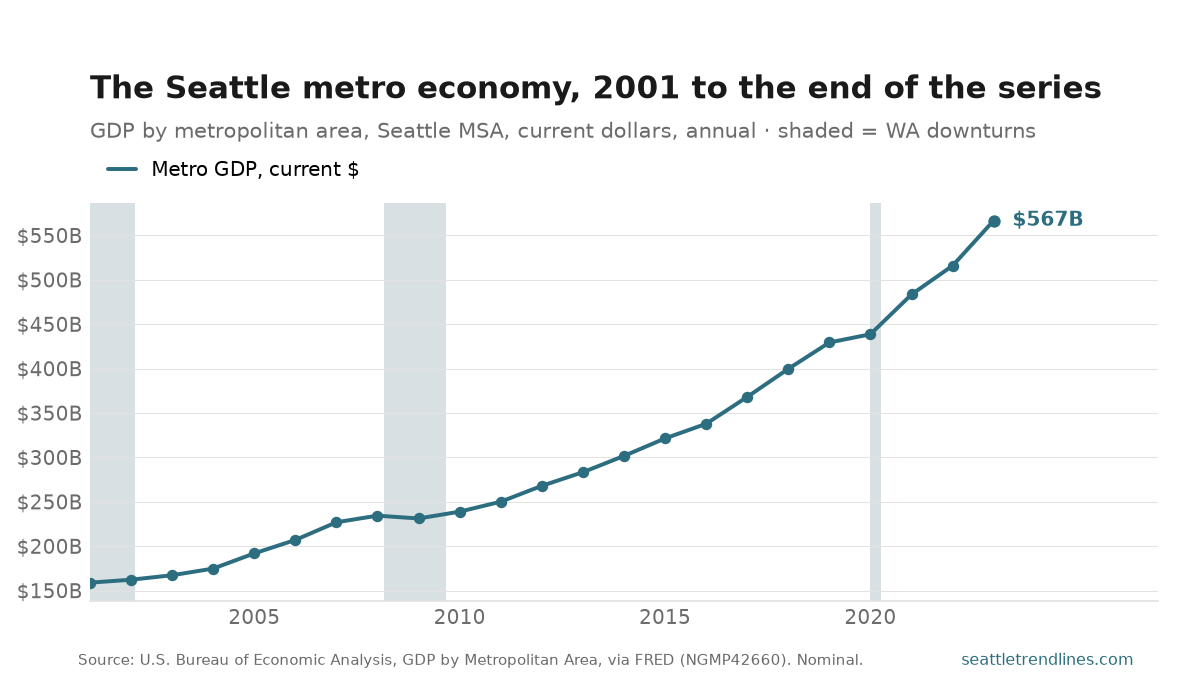
Everything produced in the three-county Seattle metro came to $567 billion in 2023, up 9.8% on the year. That is 256% more than the $159 billion the same three counties produced in 2001.
These are current dollars, not inflation-adjusted ones, so a good part of that climb is the dollar getting smaller rather than the region making more — the same caveat the gas-price post turns on. What the nominal line does show cleanly is where output actually stopped: one down year, in 2009, and a 2020 that barely moved. Seattle’s pandemic year cost the region a year of growth, not the level itself.
The geography is the Seattle–Tacoma–Bellevue MSA — King, Snohomish and Pierce counties, the same three the payroll series covers — so this is the regional economy, not the city’s. It also stops: BEA discontinued the metro-level series, which is why the line ends where it does and why there is no monthly update post behind it.
Source: U.S. Bureau of Economic Analysis, GDP by Metropolitan Area, all-industry total for the Seattle–Tacoma–Bellevue WA MSA (CBSA 42660), via FRED NGMP42660, millions of current dollars. BEA has discontinued the metro-level series; 2023 is the final official year. Bench post — generated from the latest observation in the site database.