Seattle inflation against the country, June 2026
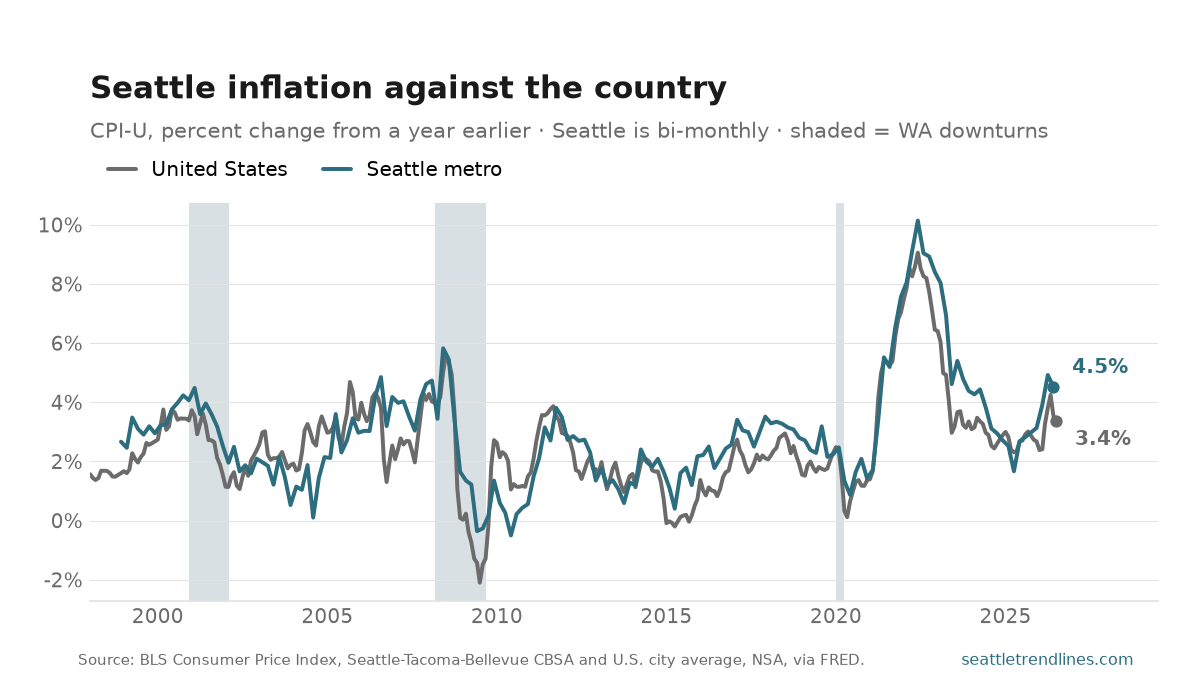
Prices in the Seattle metro were 4.5% higher than a year earlier in June 2026. Nationally the figure was 3.4% — a gap of 1.2 points, with Seattle running hotter.
The two lines mostly move together, because most of what drives inflation is national — energy, cars, the money supply. What separates them is housing. Shelter is roughly a third of the basket, it is the most local component in it, and Seattle’s has spent most of the last fifteen years rising faster than the country’s. When this region runs ahead of the national rate, that is usually what you are looking at, which is why asking rents lead this series by about a year.
Since 1998 Seattle’s rate has ranged from -0.5% (June 2010) to 10.1% (June 2022), which is the span this chart covers. One mechanical caveat: BLS publishes the Seattle index every other month, while the national one is monthly, so the local line has half as many points and the freshest national reading may be a month newer than the freshest local one.
Source: U.S. Bureau of Labor Statistics, Consumer Price Index for All Urban Consumers, Seattle–Tacoma–Bellevue CBSA (published bi-monthly) and the U.S. city average, not seasonally adjusted, via FRED. Auto-generated each build.