New listings per 10,000 King County residents, June 2026
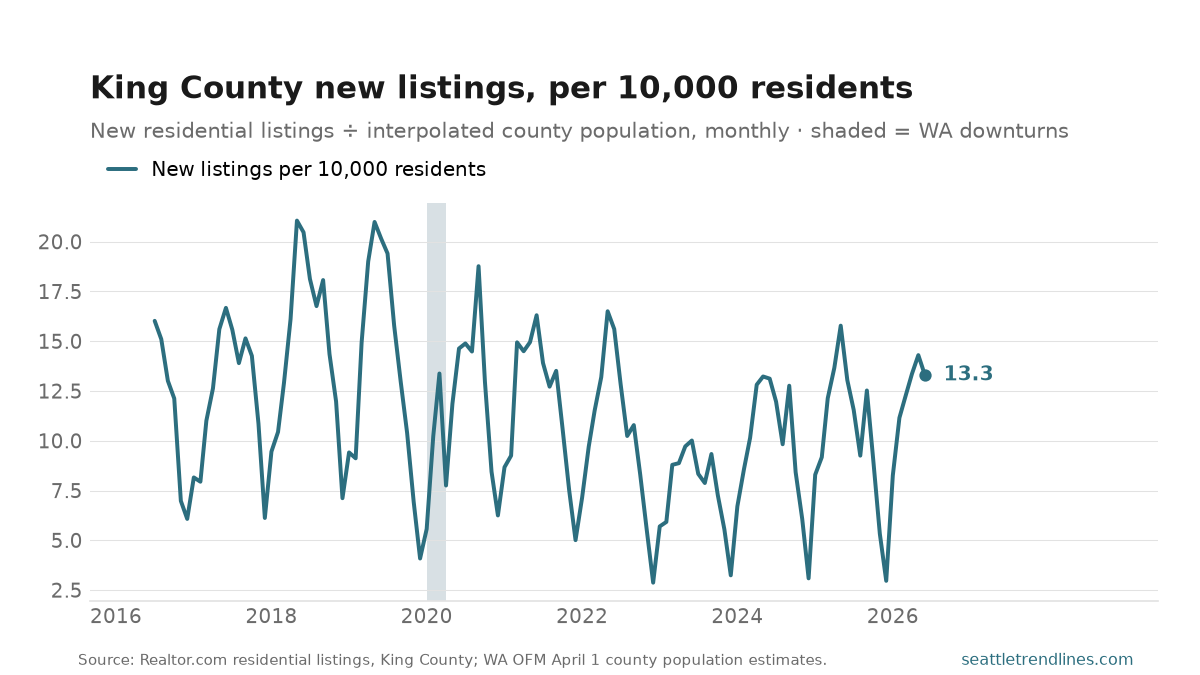
King County sellers listed 2,940 homes in June 2026 — 13.3 per 10,000 county residents, up 1.9% on the year as a rate.
Per head is what makes this series comparable across a decade, because King County in June 2026 holds a few hundred thousand more people than the one the series starts in: a listing count that merely held flat would be a market quietly thinning out relative to the county it has to house. The series opens at 16.0 per 10,000 in July 2016 and reaches 13.3 now.
Read the peaks and troughs as seasons, not as news. New listings run a hard annual sawtooth — sellers come to market in spring and go quiet in December — so the high of 21.1 in May 2018 and the low of 2.9 in December 2022 are the two ends of that cycle as much as they are the two ends of a trend. The year-on-year change is the honest comparison, and it puts June 2026 1.9% above the same month a year earlier.
This counts listings appearing, not homes selling: it is the supply side of the market, and the listing count itself is the right measure of how much work the market is doing. This one measures how much housing reaches the market relative to the size of the county. The denominator is OFM’s April 1 county estimate, interpolated between years rather than held as a step — county population between estimates genuinely moves smoothly, and a step would inject a false twelve-month sawtooth into a series that already has a real one.
Sources: Realtor.com Real Estate Data monthly inventory, King County (new listing count); Washington State Office of Financial Management April 1 county population estimates, interpolated to monthly. The rate is computed from the two series at build time rather than stored. Bench post — generated from the latest observation in the site database.