What a Seattle dollar is worth, April 2026
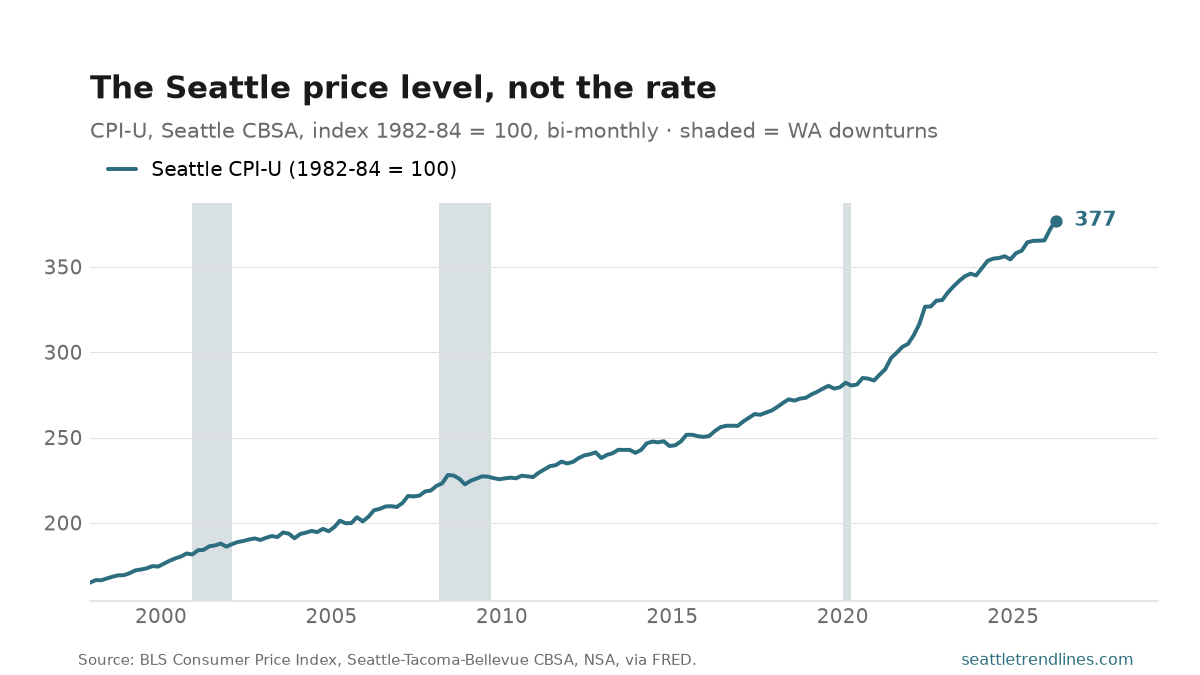
The Seattle-area consumer price index stood at 377.1 in April 2026. The index itself is not the interesting number — what it means is. Prices in this metro are 2.29 times what they were in December 1997, which is the same as saying that $2.29 today buys what $1 bought then.
Turn it around and it is starker: a dollar saved in December 1997 and left in a drawer is worth 44 cents now. That is not a Seattle failing — it is what an economy with positive inflation does, by design — but the cumulative version is rarely shown, because the news always reports the rate.
The rate is the slope of this line, and it is the subject of Seattle inflation against the country. A falling rate still means this line is going up, just less steeply — prices coming back down would be a line that turns, and it never has. Index base 1982-84 = 100, published bi-monthly for this metro.
Source: U.S. Bureau of Labor Statistics, Consumer Price Index for All Urban Consumers, Seattle–Tacoma–Bellevue CBSA, all items, not seasonally adjusted, index 1982-84 = 100, via FRED. Bench post — generated from the latest observation in the site database.